Customer Order Lead Time
Customer Order Lead Time is a new report on the Customer Service menu. It plots the average number of days between two date fields — order to ship, ship to invoice, or any pair you choose — so you can watch lead time move over a year rather than work it out an order at a time.
Add it from Customer Service → Add Report → Customer Order Lead Time.
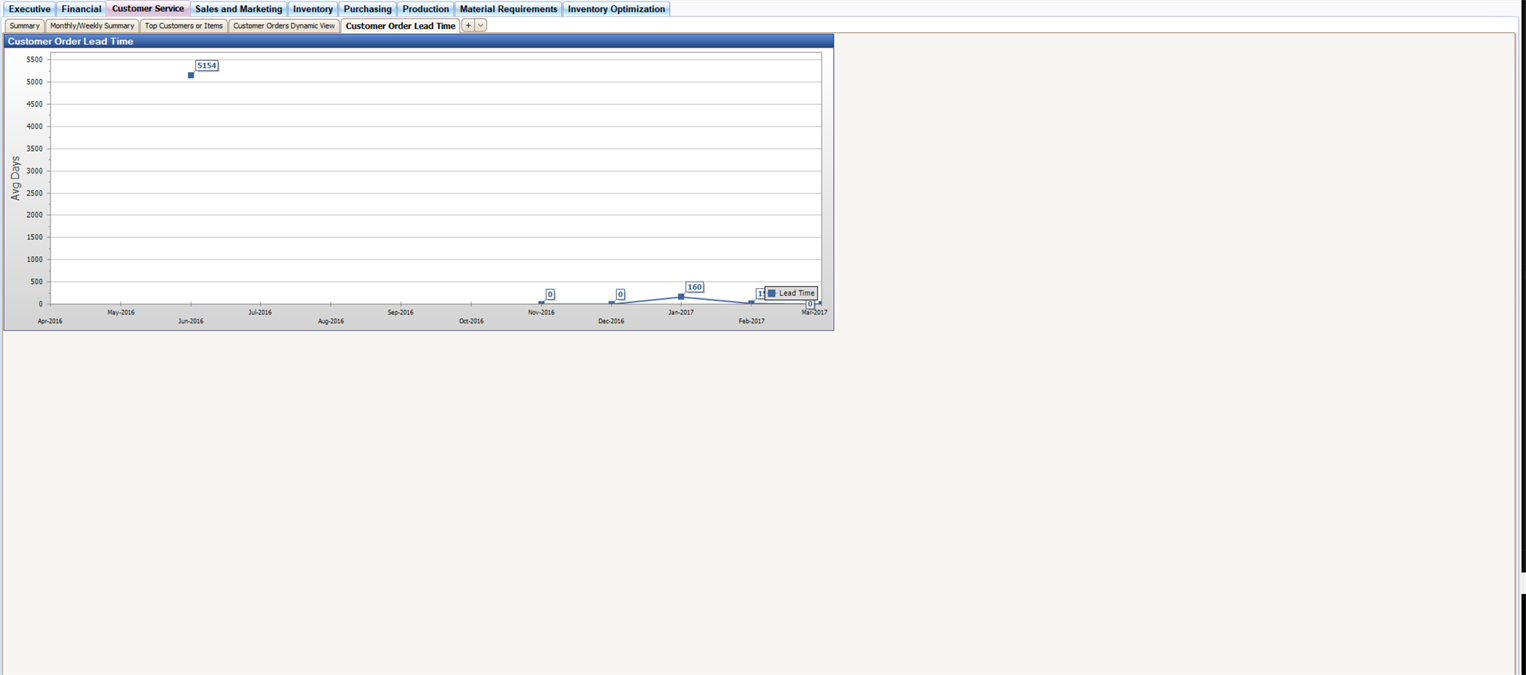
Choosing the two dates
The report averages the gap between a primary and a secondary date field, both picked on its settings screen. Order date to ship date gives you order lead time; ship date to invoice date gives you the billing lag; any other pair of dates on the invoice line works the same way.
Every day between the two dates counts, weekends and holidays included. PULSE Dashboard has no way to know which days a given company works, so the figure is calendar days rather than working days.
Daily and monthly
Points are plotted per day or per month. The months are the ones your PULSE Dashboard calendar defines, so a company on a 4-4-5 calendar or a thirteen-period year sees its own periods along the axis instead of January through December.
One line per series
Unlike the On-time Shipping Graph, the series on this report are not fixed. Add as many as you need, give each one a caption, and give each its own PULSE Dashboard filter. One graph can then compare product categories, item numbers, customers or locations side by side.
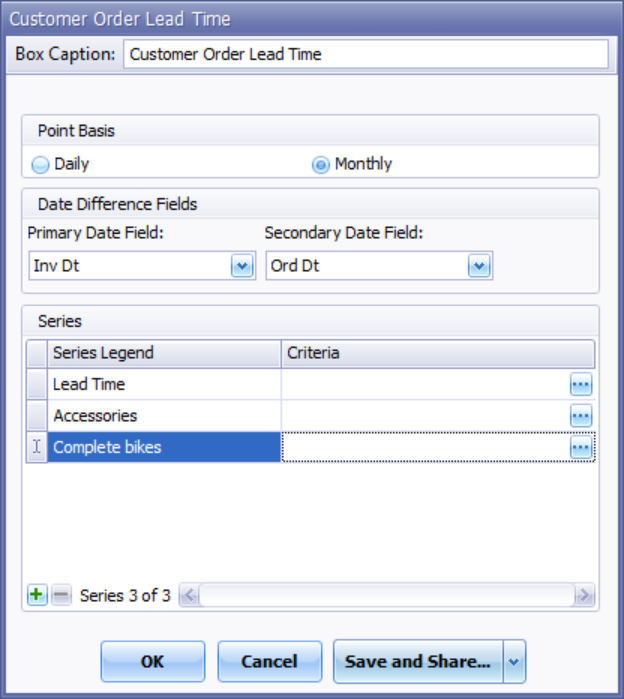
The settings screen is where the two dates are chosen and the series are built. Add and remove rows with the + and − buttons, name each series in the Series Legend column, and open the criteria builder from the button at the end of the row.
A series with no filter of its own covers every line. Where a series matches nothing in a period, the line breaks rather than dropping to zero — nothing shipped is not the same as shipped in no days.
Drilling into the lines behind a point
Click any point to open the invoice lines behind it, restricted to the series you clicked as well as to the period. A Lead Time column can be added to that grid from the Grid Layout Editor, showing each line's own figure in whole days, so you can sort the detail by the measure the chart is averaging.
The column is listed as Customer Order Lead Time - Days Between Selected Dates in the field picker, and it follows whichever two dates the box is configured with.
Getting started
Customer Order Lead Time is a new module with a module ID of its own, so — like any newly shipped report — it does not appear on the Add Report menu until you enable it in User Control. See Compatibility & Upgrade.