Pinpointing Finished Goods and Component Shortages
Adapted from the training handout Pinpointing finished goods & component shortages that are preventing on-time customer shipping (PDF, December 2018), with the column and grouping examples from Using the PULSE Material Requirements module to pinpoint production component shortages (PDF, March 2013).
Two questions decide whether you ship on time this week: which customer orders are short, and which components are holding up production orders. Pulse Dashboard answers both from your live Macola® data, with no regeneration to run first — refresh the report and the current position is on screen.
This guide covers the two shortage reports, the setup that controls what they count, and the three ways to group them so the answer arrives in the shape your job needs.
First, the data has to be worth reading
Shortage figures are only as good as the order dates and quantities behind them. Macola® calculates demand and replenishment from every open order it can see, so three habits decide whether the reports tell you the truth:
- Agree on which date field means "due". Macola® ordering screens carry several date fields, and the company has to settle on one for when a customer order really has to ship and when a purchase order is really due.
- Keep closing old orders. Demand, replenishment and allocated quantities are calculated from all open orders, and old ones are easy to overlook. Closing a purchase order to status C does not close it for this purpose — it has to reach H. Closing and purging purchase orders covers the whole cycle.
- Trust your on-order and allocated quantities, or fix them. These have to be right or neither Macola® nor Pulse Dashboard can plan from them.
A weekly pass over past-due customer, purchase and production orders — assigning each one a revised due date, and either correcting the quantity or closing the order where a purchase order was short-received — is what keeps the shortage reports honest.
The setup that controls what counts as demand
Which dates and order statuses feed the shortage calculation is a company-wide setting, and an administrator sets it once from Administration → Tools → MRP.
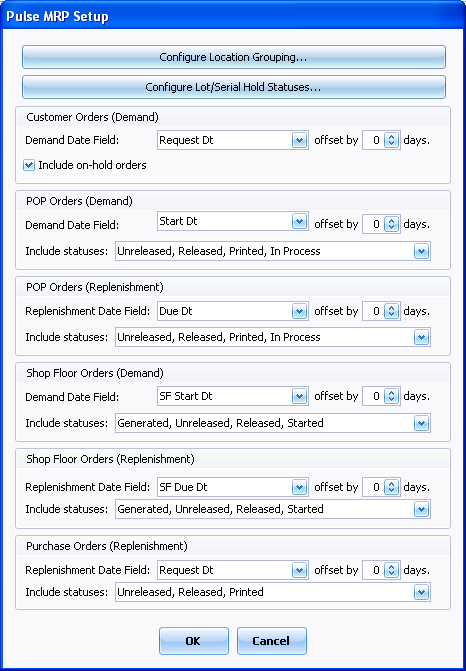
Production and shop floor orders appear twice, and that is deliberate: the parent item on the order is replenishment, while its components are demand. Purchase orders are replenishment only, customer orders demand only.
Changing these settings has no consequences to undo — nothing is stored from a previous run — but it changes what everyone sees, so it is worth agreeing between customer service, purchasing and production first. The MRP Setup screen documents every field.
There is nothing to regenerate
Pulse Dashboard plans from active orders and their next layer of components, so the current material position is available the moment you refresh a report. Macola®'s own MRP module needs a Regen run that takes minutes to hours; the two calculations are separate, and running one does not affect the other.
Are you shipping on time?
Start in the Executive module, on the Open Customer Orders report: compare Avail to Ship against the $Overall you have committed to the customer. Where available is less than committed, the orders behind the gap are the ones to chase. On-time shipping can be tracked for the whole company or broken out by customer, product category, salesperson or territory.
Shortages on customer orders
Set the number of days in the report's setup (the red wrench icon) to the horizon you care about. On a Monday, 5 days answers "do I have shortages this week?"; later in the week, run it again at 10 or 15 days.
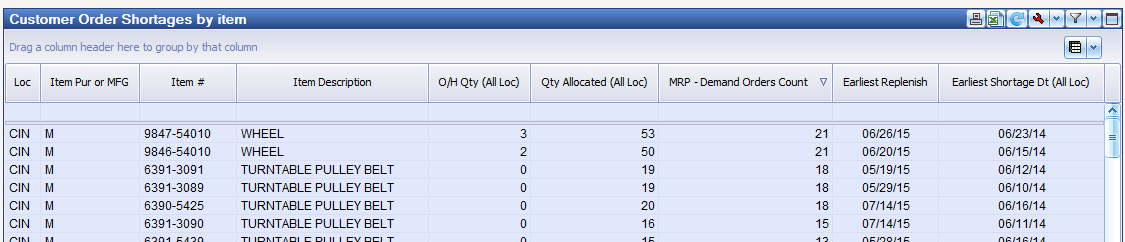
Earliest Shortage Dt is the column to sort on — it tells you how long you have. Drill down on any item to see the orders making up the demand, and what could be done about them: pulling in a purchase order, splitting a shipment, or moving stock between locations.
Shortages on production orders
The production manager's version of the same question. Again set the horizon in the report setup, then work down the list.
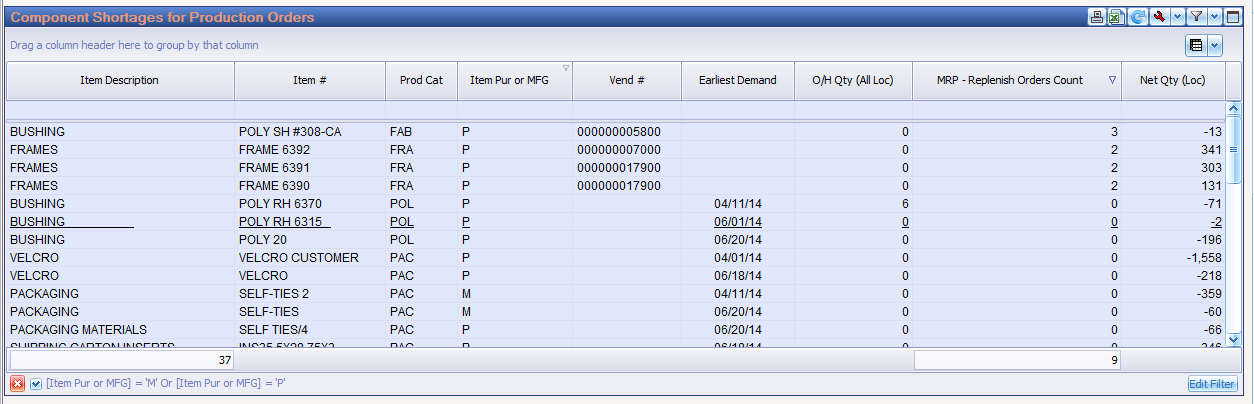
The filter bar along the bottom is worth noticing — this report is filtered to [Item Pur or MFG] = 'M' Or [Item Pur or MFG] = 'P', so purchased and manufactured components are both in view. Narrow it to P when you want the buyer's list, or to M when you want what the shop has to make.
Group the report three ways
The same shortage data answers three different questions depending on how you group it. Drag a column header into the group panel, and add the parent item columns — Par Item # and PP Item Desc 1 — so you can see which parent is creating the demand for each component.
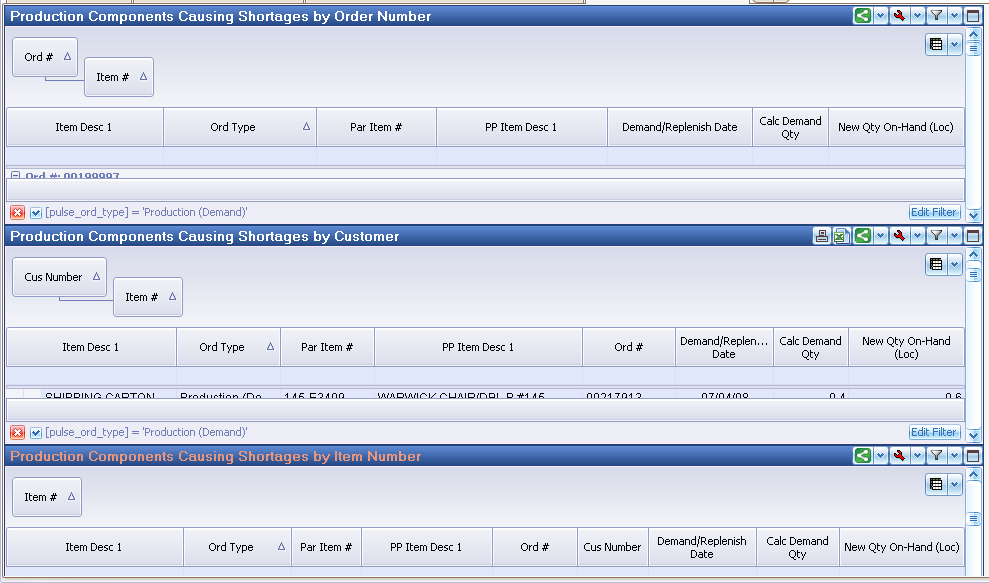
| Group by | The question it answers |
|---|---|
| Production order number | What is holding up this order? |
| Customer number | Which of this customer's orders are at risk, and why? |
| Item number | Which items are short across everything, so one purchase order fixes several problems? |
Checking an item's usage history
When a shortage looks wrong, the Inventory Transactions screen settles it. Choose the Transaction Date option, set a date range, and every movement for the item is listed with the quantity before and after.
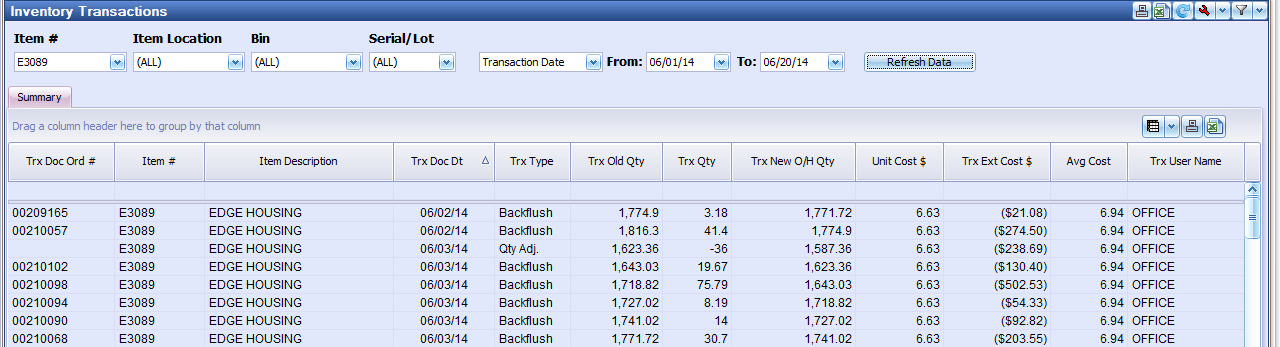
This is also the fastest way to see whether a manual adjustment is behind an unexpected quantity — adjustments appear as Qty Adj. alongside the backflush and receipt transactions.
Where to go next
- Pulse Dashboard fundamentals — refreshing data, changing columns, sorting and filtering, if any of the mechanics above were unfamiliar
- Components Causing Shortages and Items Causing Shortages — the full column reference for both reports
- MRP Setup screen — every field on the setup screen above, order type by order type
- Shortage calculation — how the engine arrives at the numbers
Tip
Need a hand? The PULSE support team is happy to help — call (513) 723-8095 or email [email protected]. Reviewing your shortage screens with you is exactly the kind of thing the support desk is for.